With this Cp/Cpk capability Excel template, you can easily assess the performance of your production processes. This template automates the studies and offers many customizable options. Before exploring its features, let’s share few words about the concept and its history (or skip here to the download section of the Cp/Cpk capability Excel free template).
Introduction
The concept of process capability, often abbreviated as Cp, originated in the American automotive industry during the 1970s and has since become essential in statistical process control. It is particularly crucial for assessing the performance and reliability of production processes.
Process capability can be defined as the ability of a machine or process to consistently meet the specifications outlined in the design requirements. In other words, it measures how well a process can produce conforming parts within the defined tolerance range, bound by upper and lower specification limits.
Process capability indices, such as Cp and Cpk, provide quantitative indicators that help organizations identify potential variations and optimize their processes for consistent quality. By controlling capability, businesses can improve operational efficiency and enhance customer satisfaction by delivering products that consistently meet expectations.
This Cp/Cpk Excel Template (Free Download) streamlines the calculation of Cp/Cpk for any metrics or process parameters. By simply entering the measured values and tolerances, the automated formulas quickly calculate the Cp/Cpk values, offering valuable insights into process performance and variability.
Main Features
The template automatically generates:
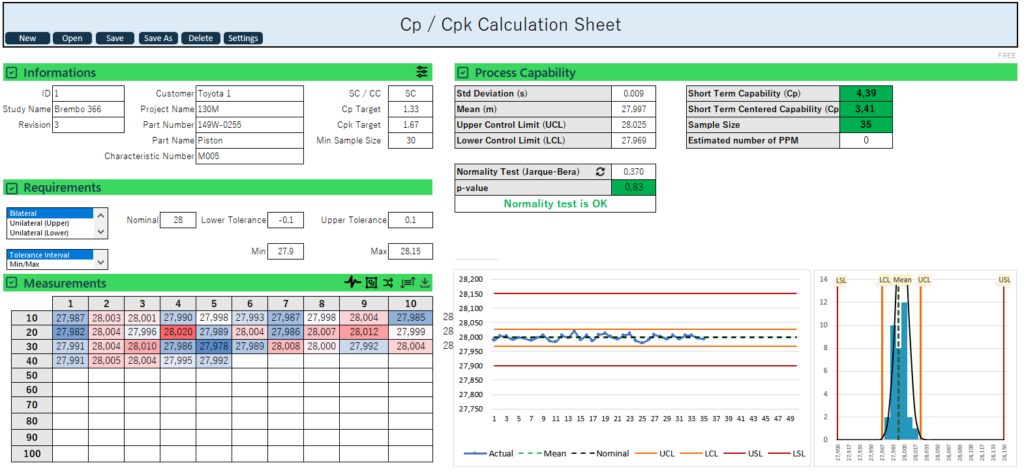
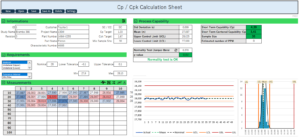
- Cp/Cpk values and related figures (mean, standard deviation, sample size)
- UCL/LCL values
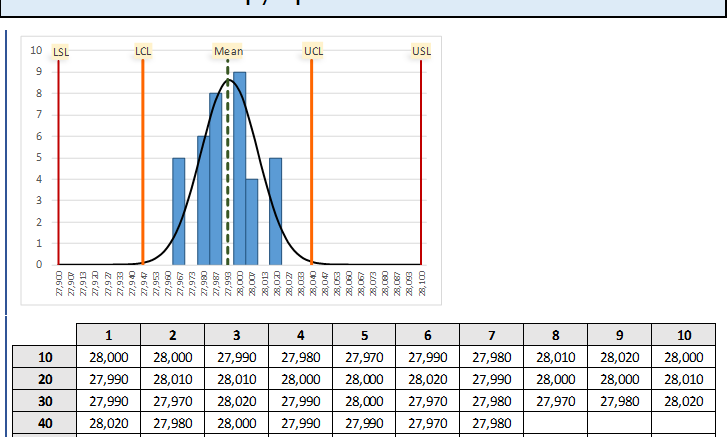
- 2 visual graphs
- Up to 500 measurements per study
You can save 5 studies in one file:
- Each study have its own Cp/Cpk target
- The “Records” sheet can be used to generate helicopter views
- You can save as, delete, open or create a new study.
Additionnally, the tool:
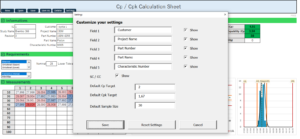
- Is fully customizable to your field (industry, education, research, …)
- Evaluates Normality using Jaque-Bera method
- Estimates PPM (Defects per Million)
- Creates Heat Map
- Sort or Shuffle the values
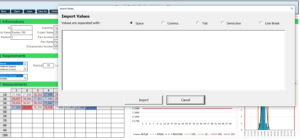
- Import values with any data separator
- Generates dummy values within the tolerance interval (use responsibly)
Screenshots
Download link
To download this free Cp/Cpk Excel Template, click on the following link :
To download the PRO version (unlimited number of studies in the same file), click on the following link : PRO Version
License
- This tool is free
- It can be modified by the user
- Cannot be redistributed or sold
Compatibility
- PC Excel 2024 : OK
- PC Excel 2021 : OK
- PC Office 365 : OK
- PC Excel 2019 : OK
- MAC – Excel 2024 : OK
- MAC – Excel 2021: OK
- MAC Office 365 : OK
Additional details
- Language(s): English
- Revision 2
- 6414 Downloads
If you like this tool, you will love:
Gantt Chart Maker: Our most popular tool for project managers. It will help you make awesome project schedules and meet your deadlines. It has more than 10 years in service and 150,000+ downloads. Try the free version first.


Im having trouble, when I save a study and I go to open it back up it only allows the first 2 data points of each subgroup to show? It appears the rest of my data is gone.
love the spreadsheet and the article. but on the spreadsheet. if the data contains 3 digits (i.e. 280 instead of 28), the bell curve doesn’t show.
Hello Steve, Thank you for the feedback, I really appreciate. This have been corrected (version 4.3) and a PRO version + PRO version of the Gantt Chart Maker sent in your mailbox. A new feature was added : generate dummy values within the tolerance interval (use with caution). Thank you again.
Really enjoyed this article! The tips are actionable and the content is well-presented. Looking forward to more articles.
Thank you, I appreciate your feedback. Let me know if you have any question about this new release of the tool and the improvements you would like to see in the future.
Excellent article! The tips are actionable and the content is well-organized. I look forward to your next post.
Well-done post! The advice is practical and the writing is engaging. I look forward to reading more from you.
Great work! The content is practical and the writing is clear. I’ll definitely keep these tips in mind.
I found this article very helpful. The content is clear and the advice is practical. Thanks for the great information!
Fantastic job! The article is both informative and engaging. I appreciate the practical advice and clear writing.
I enjoyed reading this article. The content is relevant and your writing style is engaging. Keep it up!
Fantastic work! The explanation is detailed, and the Excel file is very user-friendly. I’ll be using this frequently.
Really enjoyed this post. The explanation is clear, and the Excel file is incredibly useful. Thanks for making it so straightforward!
Really enjoyed this article! The tips are practical and the writing is clear. Looking forward to your next post.
Fantastic work! The information is useful and your enthusiasm is evident. I’ll definitely be referring back to this.
Fantastic content! The statistical method is well-explained, and the Excel file is a game-changer for quick calculations. Excellent work!
Fantastic read! Your explanations are clear and the tips are very useful. Thanks for sharing your knowledge!
Really enjoyed this one! The content is engaging and the tips are very useful. Thanks for the great insights!
Well-written and informative! The advice is actionable and the content is engaging. Thanks for sharing your expertise!
Fantastic post! The content is useful and your enthusiasm is evident. Thanks for the great advice!
Fantastic job on this post! The content is clear and the tips are very useful. Thanks for the valuable information.
please clarify 12 mm (+0.006/+0.024) is unilataral or bilateral for cp , cpk calculation .
Excellent post! The tips are actionable and the writing is clear. I appreciate the effort you put into this.
Fantastic article! The information is useful and the writing style is clear. I appreciate the effort you put into this.
Well-done article! The information is clear and the tips are very useful. Thanks for the valuable insights.
This post is so insightful! I learned a lot and appreciated the clarity. Thanks for sharing your knowledge!
Nice
I loved this article! The advice is actionable and the writing is engaging. Looking forward to your next post.
Great job on this article! The content is both informative and engaging. I appreciate the practical tips and clear writing.
Great job on this post! The information is practical and the writing is clear. Thanks for sharing your insights!
Really helpful post! Your insights are valuable and presented in a clear manner. Thanks for the great advice!
Well-written and informative! The tips are actionable and the content is engaging. Thanks for the valuable insights.
Well done! The content is engaging and the tips are actionable. I look forward to reading more from you.
Really enjoyed this article! The tips are practical and the content is well-organized. Thanks for the valuable insights!
Great job on this post! The content is well-organized and the advice is actionable. Thanks for sharing!
Great job on this post! The information is practical and the writing is clear. Thanks for sharing your insights!
WOW! I miss the old internet when we could find useful information. Thanks for bring sexy back.
Well-written and informative! The content is useful and the advice is actionable. Thanks for sharing your expertise.
Excellent article! The tips are actionable and the content is well-organized. I appreciate the valuable advice.
Really enjoyed this one! The content is engaging and the tips are very useful. Thanks for the great insights!
Great read! The article is engaging and the tips are actionable. I’ll definitely keep these ideas in mind.
Thank you, I need a help how to copy the chart and link with my data. And also how I can increase my sample size according to my needs.
This was an excellent read! The content is relevant and well-presented. I’ll be keeping these tips in mind.
Really enjoyed this read. The content is engaging and the advice is very practical. Thanks for sharing!
Fantastic article! The explanation of statistical techniques is clear, and the Excel tool is super helpful. Thanks for making this complex topic easy to understand!
Great work on this post! The tips are actionable and the content is well-presented. Thanks for the great read!
Fantastic job! The article is informative and your tips are actionable. I learned a lot from reading this.
Really enjoyed this article! The content is practical and the writing is clear. Looking forward to your next post.
Fantastic work! The information is useful and your enthusiasm is evident. I’ll definitely be referring back to this.
Really enjoyed this article! Your insights are valuable and the writing is engaging. Looking forward to more posts!
Well-done article! The tips are practical and the writing is engaging. Looking forward to more from you.
I found this article very engaging. The tips are practical and the content is presented clearly. Great job!
Fantastic read! The advice is practical and the writing is clear. I’ll definitely be using these tips.
Hi
Thank you.
I want to modify the sheet to my data layout, but when I look at the references in the chart they point to ‘1 – data’ or ‘2 – data’ sheet. I can’t find these sheet. Please help.
Well done! The article is informative and your writing is engaging. I’ll definitely be referring back to this.
I loved the clarity of this post. The methods are well-explained, and the Excel tool is both effective and user-friendly. Thanks for providing such a helpful resource!
Great job on this post! The content is informative and the advice is actionable. I appreciate the effort you put in.
I loved this article. The statistical concepts are well-explained, and the Excel tool is very practical. Thanks for sharing these resources!
Thanks, nice tool
Thank you so much. I appreciate this template, it is doing exactly what is expected and supports usage of statistical tools in my scope of work. Cheers from Malaysia
Thank you
Thanks and it is useful
Thanks for sharing the Best Cp & Cpk Template and the Gantt Chart Maker!
This CPK template is user friendly and very comprehensive!
Thank you so much for this valuable example, great job.
Thanks for the Cp & CpK software
Best CpCpk template I found on the internet. Keep pushing!
good help
Thank you so much
Super!
Thanks!